
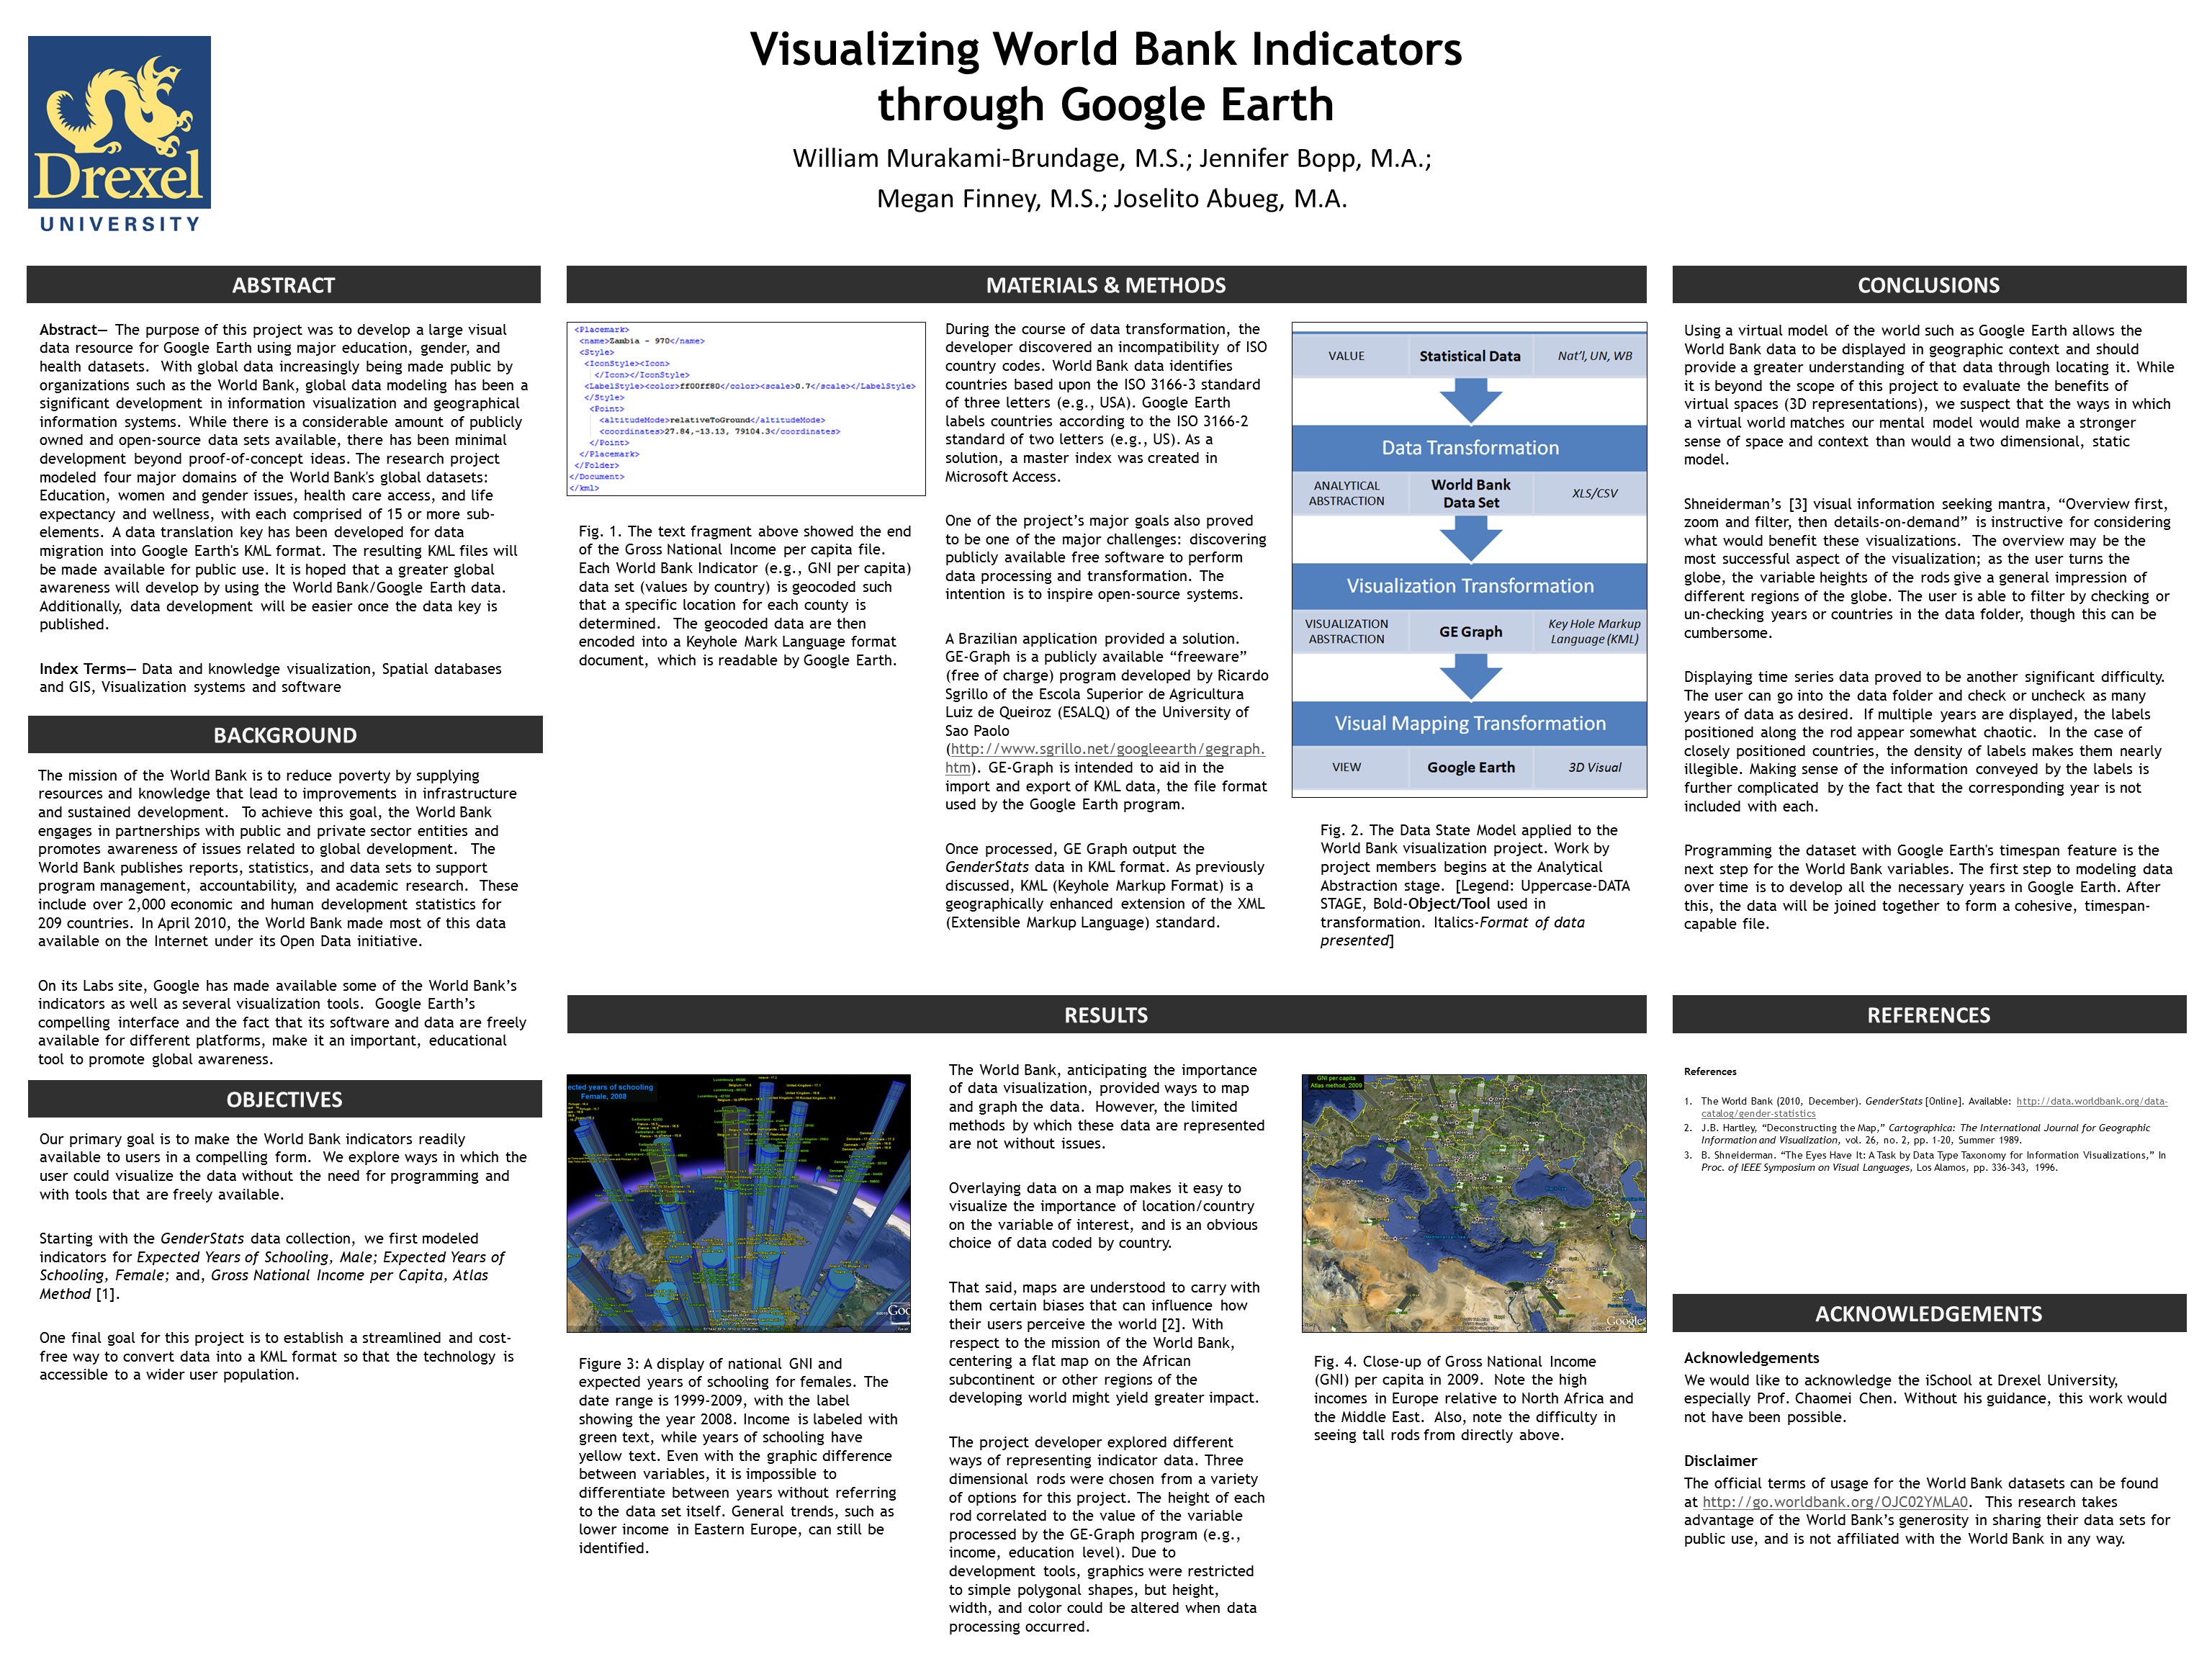
At this point, I kind of forget where my research is going, and also where it has been. Anyways, I will send this out on the Internetz for anyone whom is interested. It is the corresponding presentation to the KML files that you can find in the previous blog entry.
This poster was part of the 10th Annual Hawaii International Social Science Conference, held in Waikiki, Hawaii. At the time, I was working on coursework for Drexel’s Masters of Information Systems program – I think the course this stems from was Prof. Chaomai Chen’s Information Visualization (INFO 633). While I have reservations about Drexel’s administration, for the most part the faculty are both productive and scholarly.
Take a look, have a fun time with it. If you have any comments, feel free to drop me a line!
Related articles
- Visualizing World Bank Indicators: Research Poster (velluminformation.com)
- Google Earth, World Bank Data, and KML Files (velluminformation.com)
- Suggestion for information designers to train? (ask.metafilter.com)
- Hawaii to add sand to Waikiki beach (seattletimes.nwsource.com)
- Communicating at Poster Presentations (betulpamuk.wordpress.com)

Pingback: Academic Experiences in Computer Information Systems: Associate vs. Graduate Education |