
I’m working through Data Mining for the Masses (yes, at the same time as I’m working through Machine Learning for R.) I’ve found that hitting the same topic from multiple angles helps to embed the concepts and lessons much more firmly. Some people would say that approaching R and RapidMiner at the same time is foolhardy, but I actually think it is vital to learning in depth about data science in general. A critical facet of data science is that it is tool-heavy, with players such as SPSS, SAS, SAP, Oracle, and IBM all fighting over the same data real estate. I’ve always been prone to using long-term, supported software packages that are free (hence, R and RapidMiner), but feel that these skills translate well across playing fields – a part of data analytics is the foundation and skills involved, which evolves into the universal concepts of statistics, probability, and mathematics.
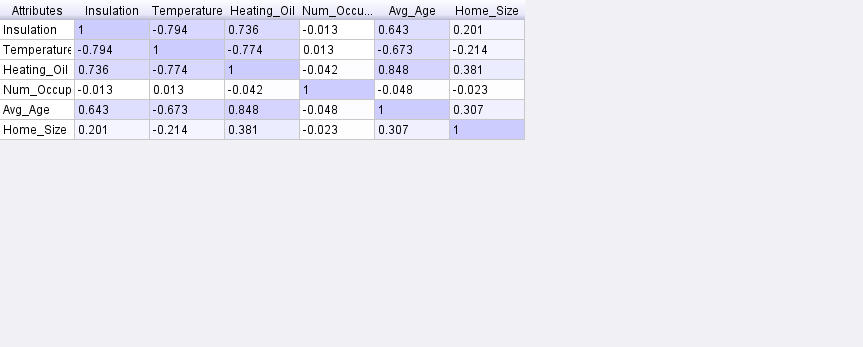
To elucidate my current lesson, there is a 1,400 item housing data set that I’ve generated a correlation matrix for (i.e. Data Mining for the Masses, Chapter 4.) I’m always impressed with the alacrity that RapidMiner generates these graphics and tables. the YALE project did well, all things considered.
Related articles
- Video: Data Mining with R (revolutionanalytics.com)
